Total Sales Report
This is a powerful suite of reports giving details about overall sales in a selected period.
The total sales report is in fact a range of reports that provide detail about overall sales in a period of your choosing. The primary screen is shown below.
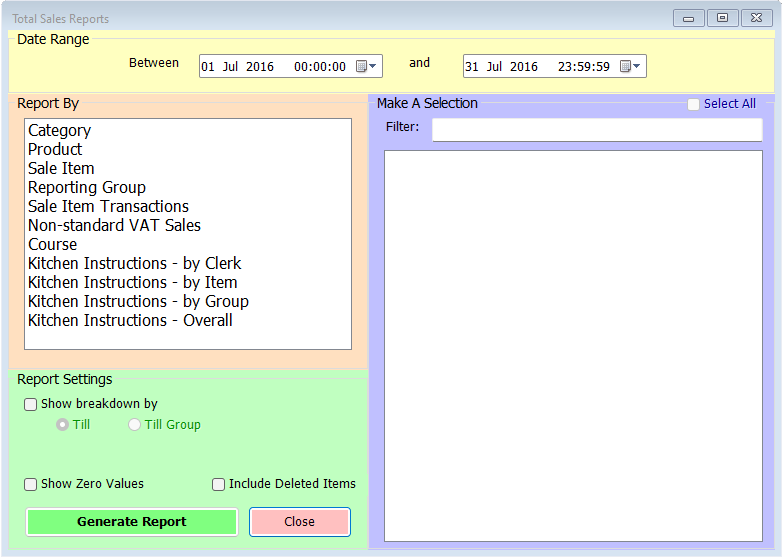
The date range you wish to use for the report is set using the start and end date selectors at the top of the screen. For the first four types of report, the length of the report is unaffected by the size of the date range so you can safely select as broad or as narrow a range as you wish. Naturally, the larger the date range the longer the report will take to build but even periods of over a year should only take a few seconds.
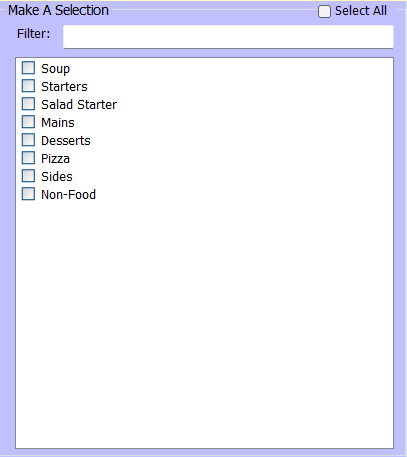
Next you will need to select the type of report from the list on the left. The first four are the most commonly used – Category, Product, Sale Item or Reporting Group. Selecting one of these will generate a list of the corresponding entries on the right hand side.
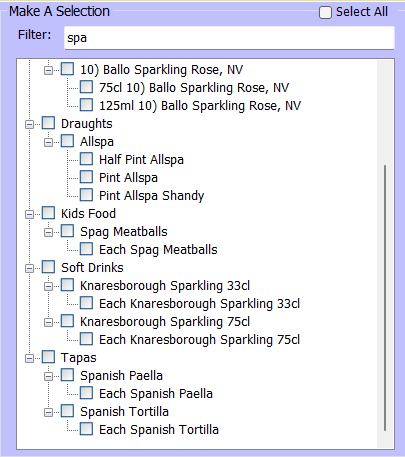
You can then select the items that you want to report on either by clicking them individually, searching for them using the filter box at the top to type the first few letters or select all relevant options by clicking the Select All option at the top right.
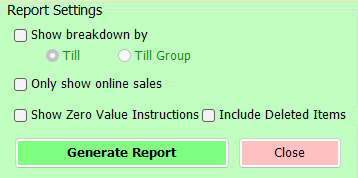
There are some additional options for these reports which may be useful.
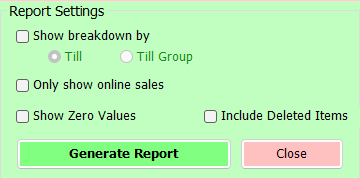
By default the reports give an overall figure for gross sales of the selected items in the period but it is possible to have the figures broken down in one of 2 ways – per till or per till group (where these have been defined). All sales are included normally but you can choose to report solely on Online sales. Also by default, lines where no sales have been recorded in the selected period are hidden but you can also select to see these zero values. Finally there’s the option to include in the selectable list items which have been deleted. This is particularly relevant when reviewing historic sales reports. Once you’ve made your selections just click ‘Generate Report’.
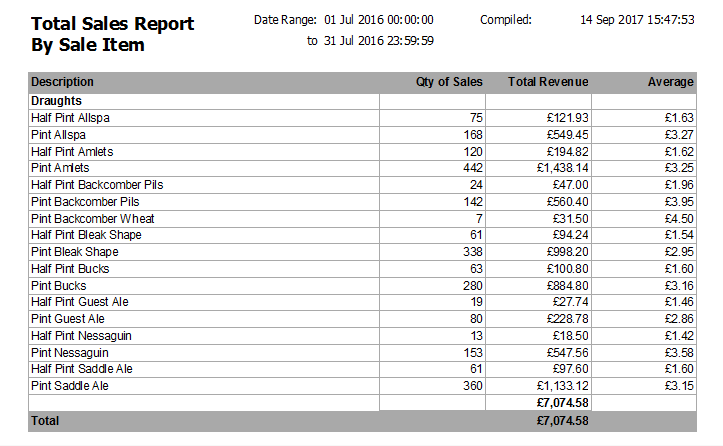
The reports for Category, Sale Item and Reporting Group all generate similar headings with Number of items sold, Total Revenue and Average Revenue. The Sale Item option has sub-headings by category.
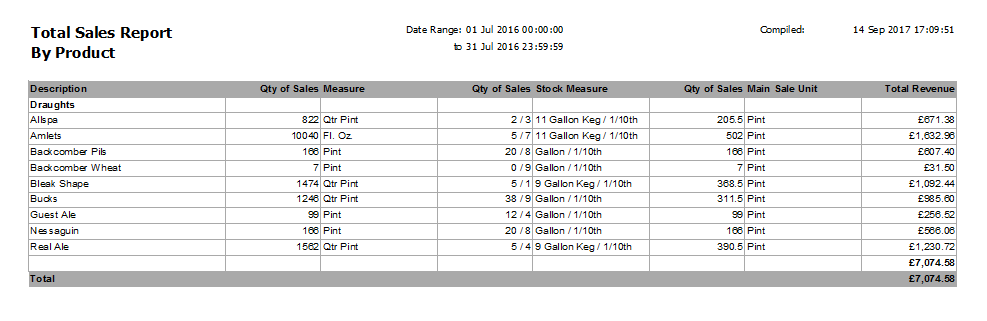
The Product report is different in that is is focused more on the overall quantity of each product sold rather than the number of separate items and is intended more as a stock type of report. It therefore has a figure for the amount of product sold in the period expressed in terms of the smallest measure, the stock take measure(s) and the main sale unit. For many products two or even all three of these would be the same, but for key stock lines such as draught beers, wines and spirits they’re usually very different.
The next report option is Sale Item Transactions. As with the sale item report you can select individual sale items in the selection list on the right, but this report provides a breakdown of every separate transaction involving the selected item(s) in the report period.
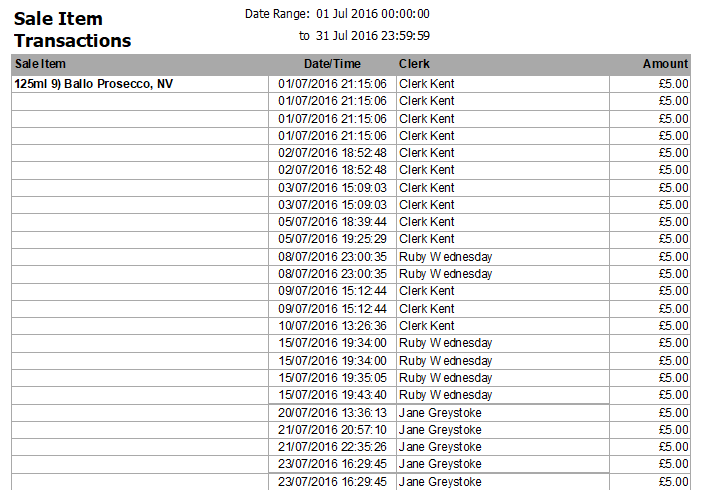
For each selected sale item there are lines showing the time and date of each sale, the clerk responsible and the sale price.
Non-standard VAT Sales is the next option. This doesn’t provide a selection list, instead this report shows all sales in the selected period where the VAT rate applied isn’t the standard rate.
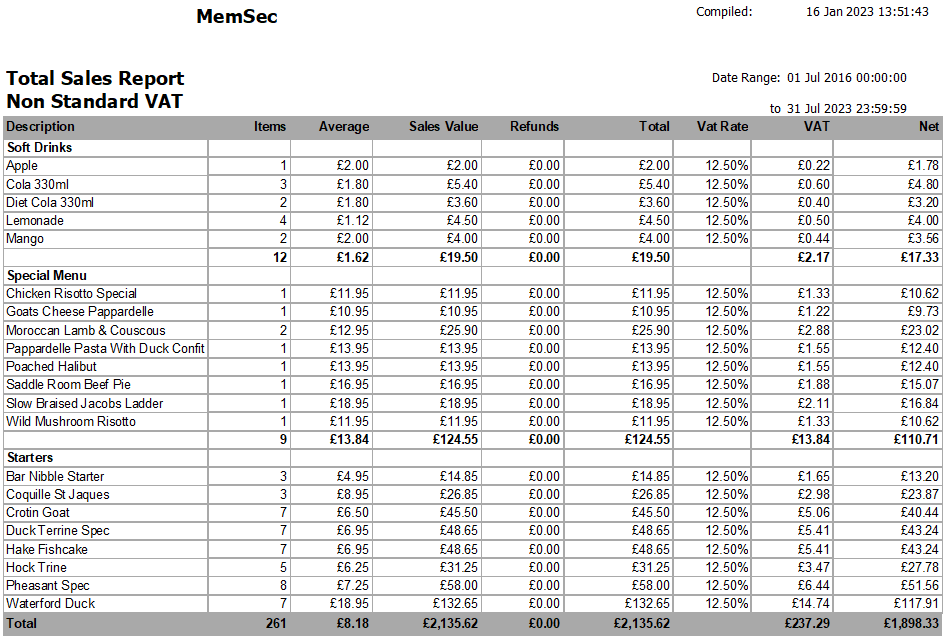
The report is broken down by category, then sale item, and shows how many were sold in the period, the average retail price, gross revenue, any refunds, the total revenue, the VAT rate applied, consequent VAT value and net revenue.
The next report allows you to view sales by course. While this is obviously primarily a food report, listing all food courses configured (even if deleted), there is also the option to report on non-food.
The report provides similar columns to the Non-standard VAT report;

For each course you can see the number of items sold in the period, the average sale price, gross revenue, any refunds, total revenue, VAT and total net revenue.
Finally, there are four separate reports based around kitchen instructions. The default for these reports is to only show instances where the instruction carried an additional cost, but in the Report Settings section you can choose to include zero priced instructions.
The first of these four reports offers you a breakdown by clerk, so you can see who used which instructions in the selected period. The right hand list will show all current staff and you have the option to also include deleted staff.
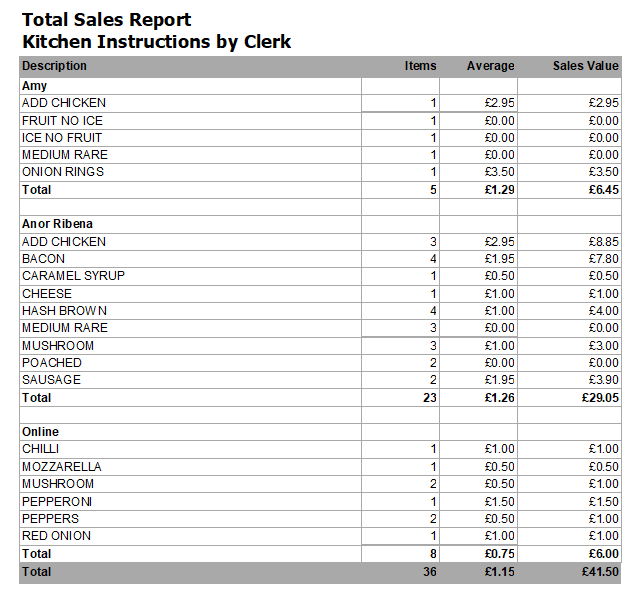
Each selected staff member is listed alphabetically and each instruction they used in the period then has a line showing the number of instances, average price and total value of that instruction.
The report for Kitchen Instructions by Item shows all instructions applied to the selected sale item(s) in the period.
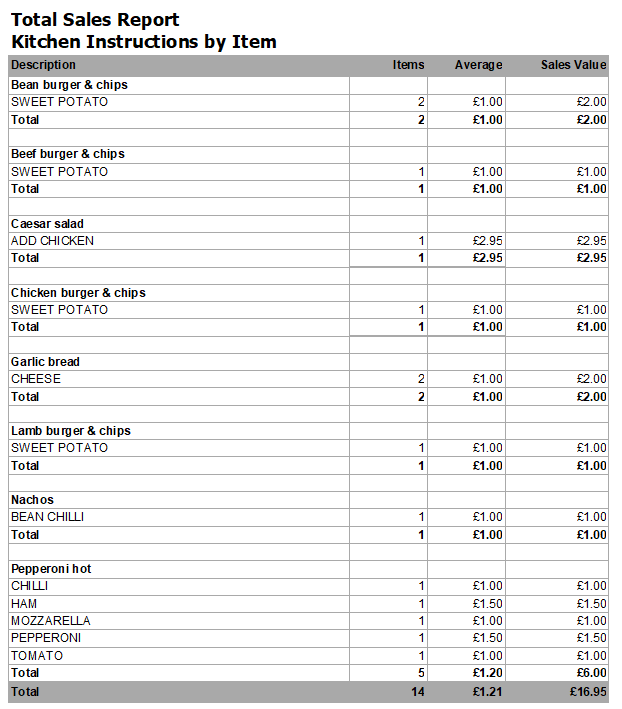
Similar to the clerk version, each sale item is listed and then each of its instructions has a line with the same columns. Items, Average and Sales Value.
The third kitchen instruction based report is by Group. Where instructions have been grouped together such as flavourings or cooking instructions, this report allows you to see which of the group members have been chosen in the period.
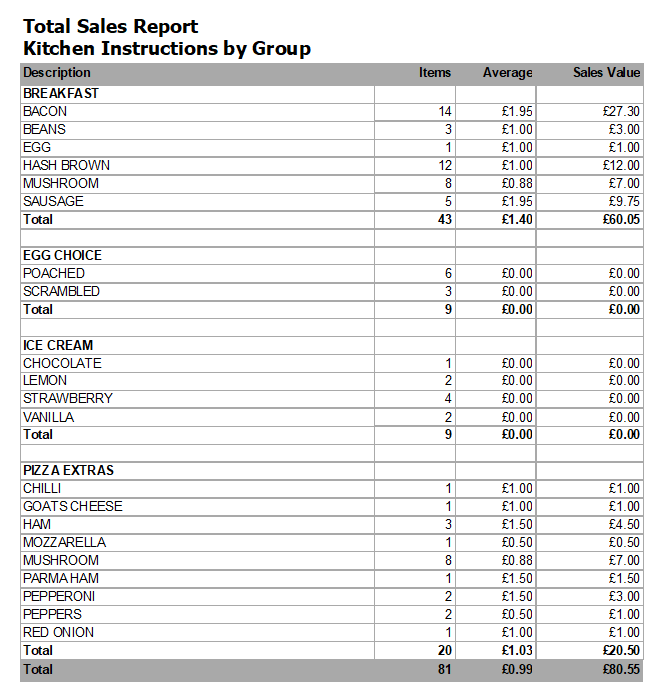
Once again, each group name is listed followed by a line for each instruction used in that group with the same headings.
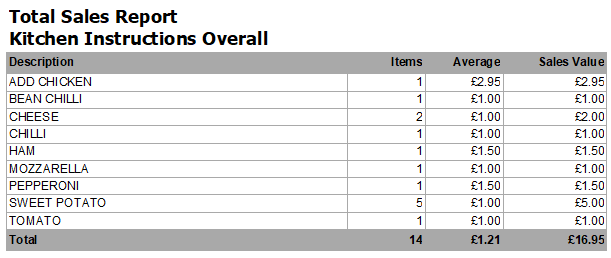
The fourth and final instructions report is the overall option. This doesn’t provide a selection list, rather it summarises every instruction used in the selected period, again with the headings Items, Average and Sales Value.