Comparisons & Charts
View sales performance over time
This collection of reports provides a breakdown of sales in the selected period into constituent time periods and compares performance with previous periods.
When you first view the form you are presented with a number of options to choose from.
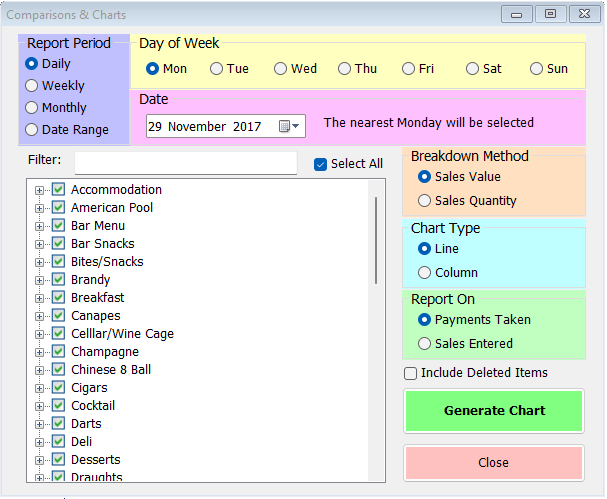
On the right hand side there are some choices about how the data should be compiled and displayed;
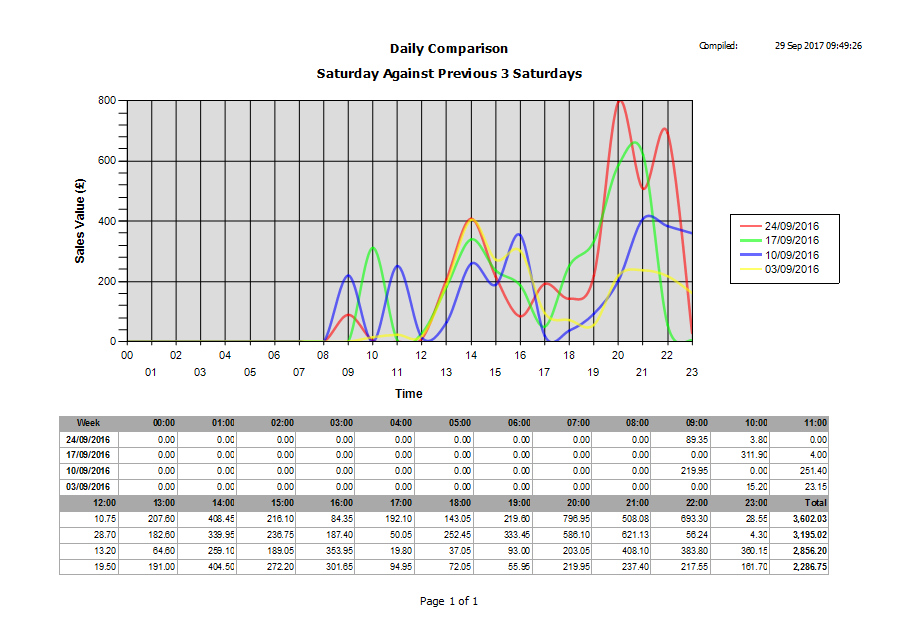
There are four options for the report period; Daily provides a choice of weekdays and will show data for the selected day, broken down hour by hour and for the week selected in the date range and the previous 3 weeks.
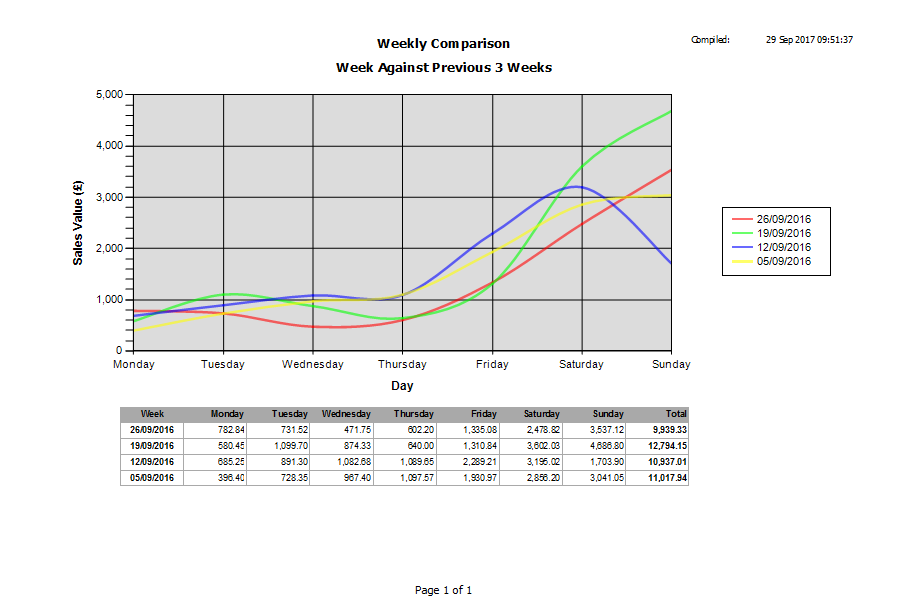
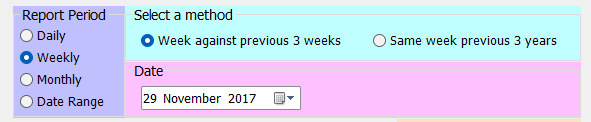
Weekly offers a similar comparison of daily totals for the week selected but has a choice of either the 3 previous weeks or the same week in the previous 3 years.
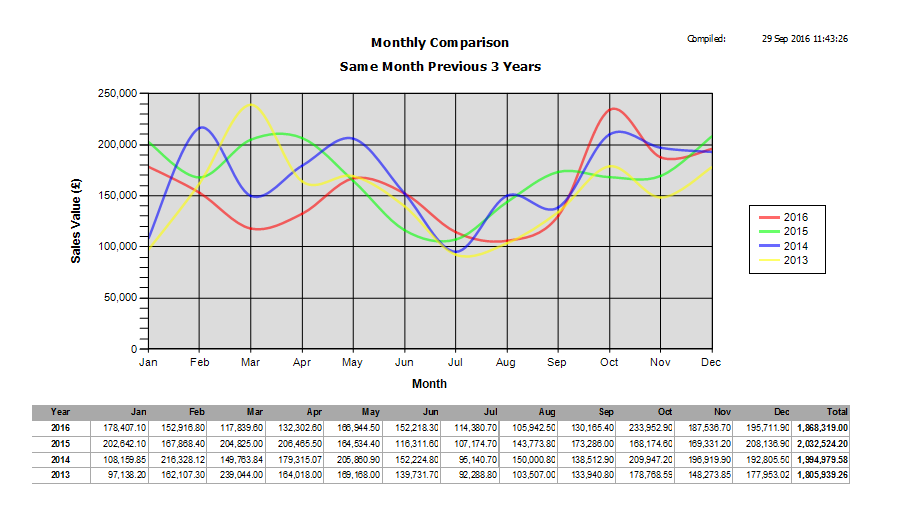
The monthly option provides a month-by-month analysis of sales for the current year to date against the previous 3 years.
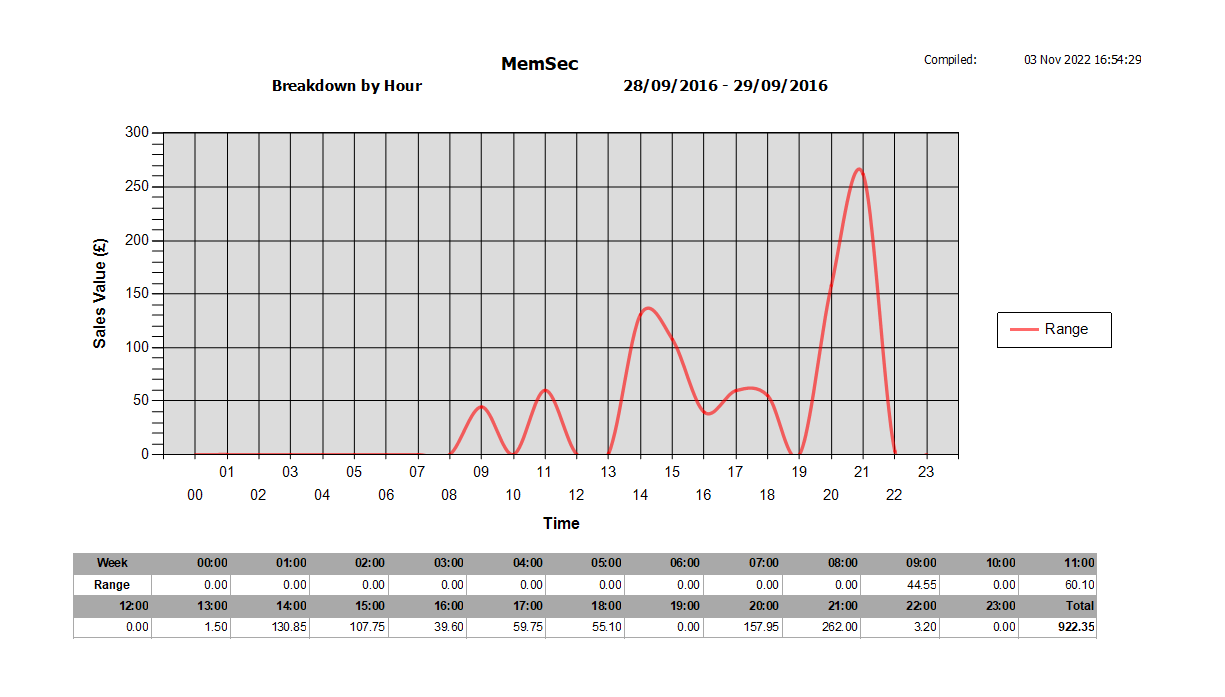
Lastly there’s the option to select a date range.
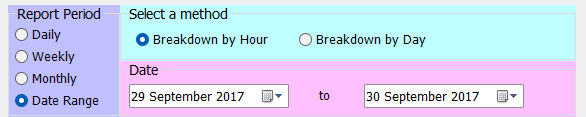
Here you can select the range and choose whether to break down the report by the Hour or by the Day.
You can select which categories and constituent sale items the report includes. By default all items are selected. Once you have made all your selections you can then click on ‘Generate Chart’. The system will then prepare a table based on the time period and items chosen and will display a graphical representation of the figures above the table. Examples of the Daily, Weekly, Monthly and Date Range reports are shown below.